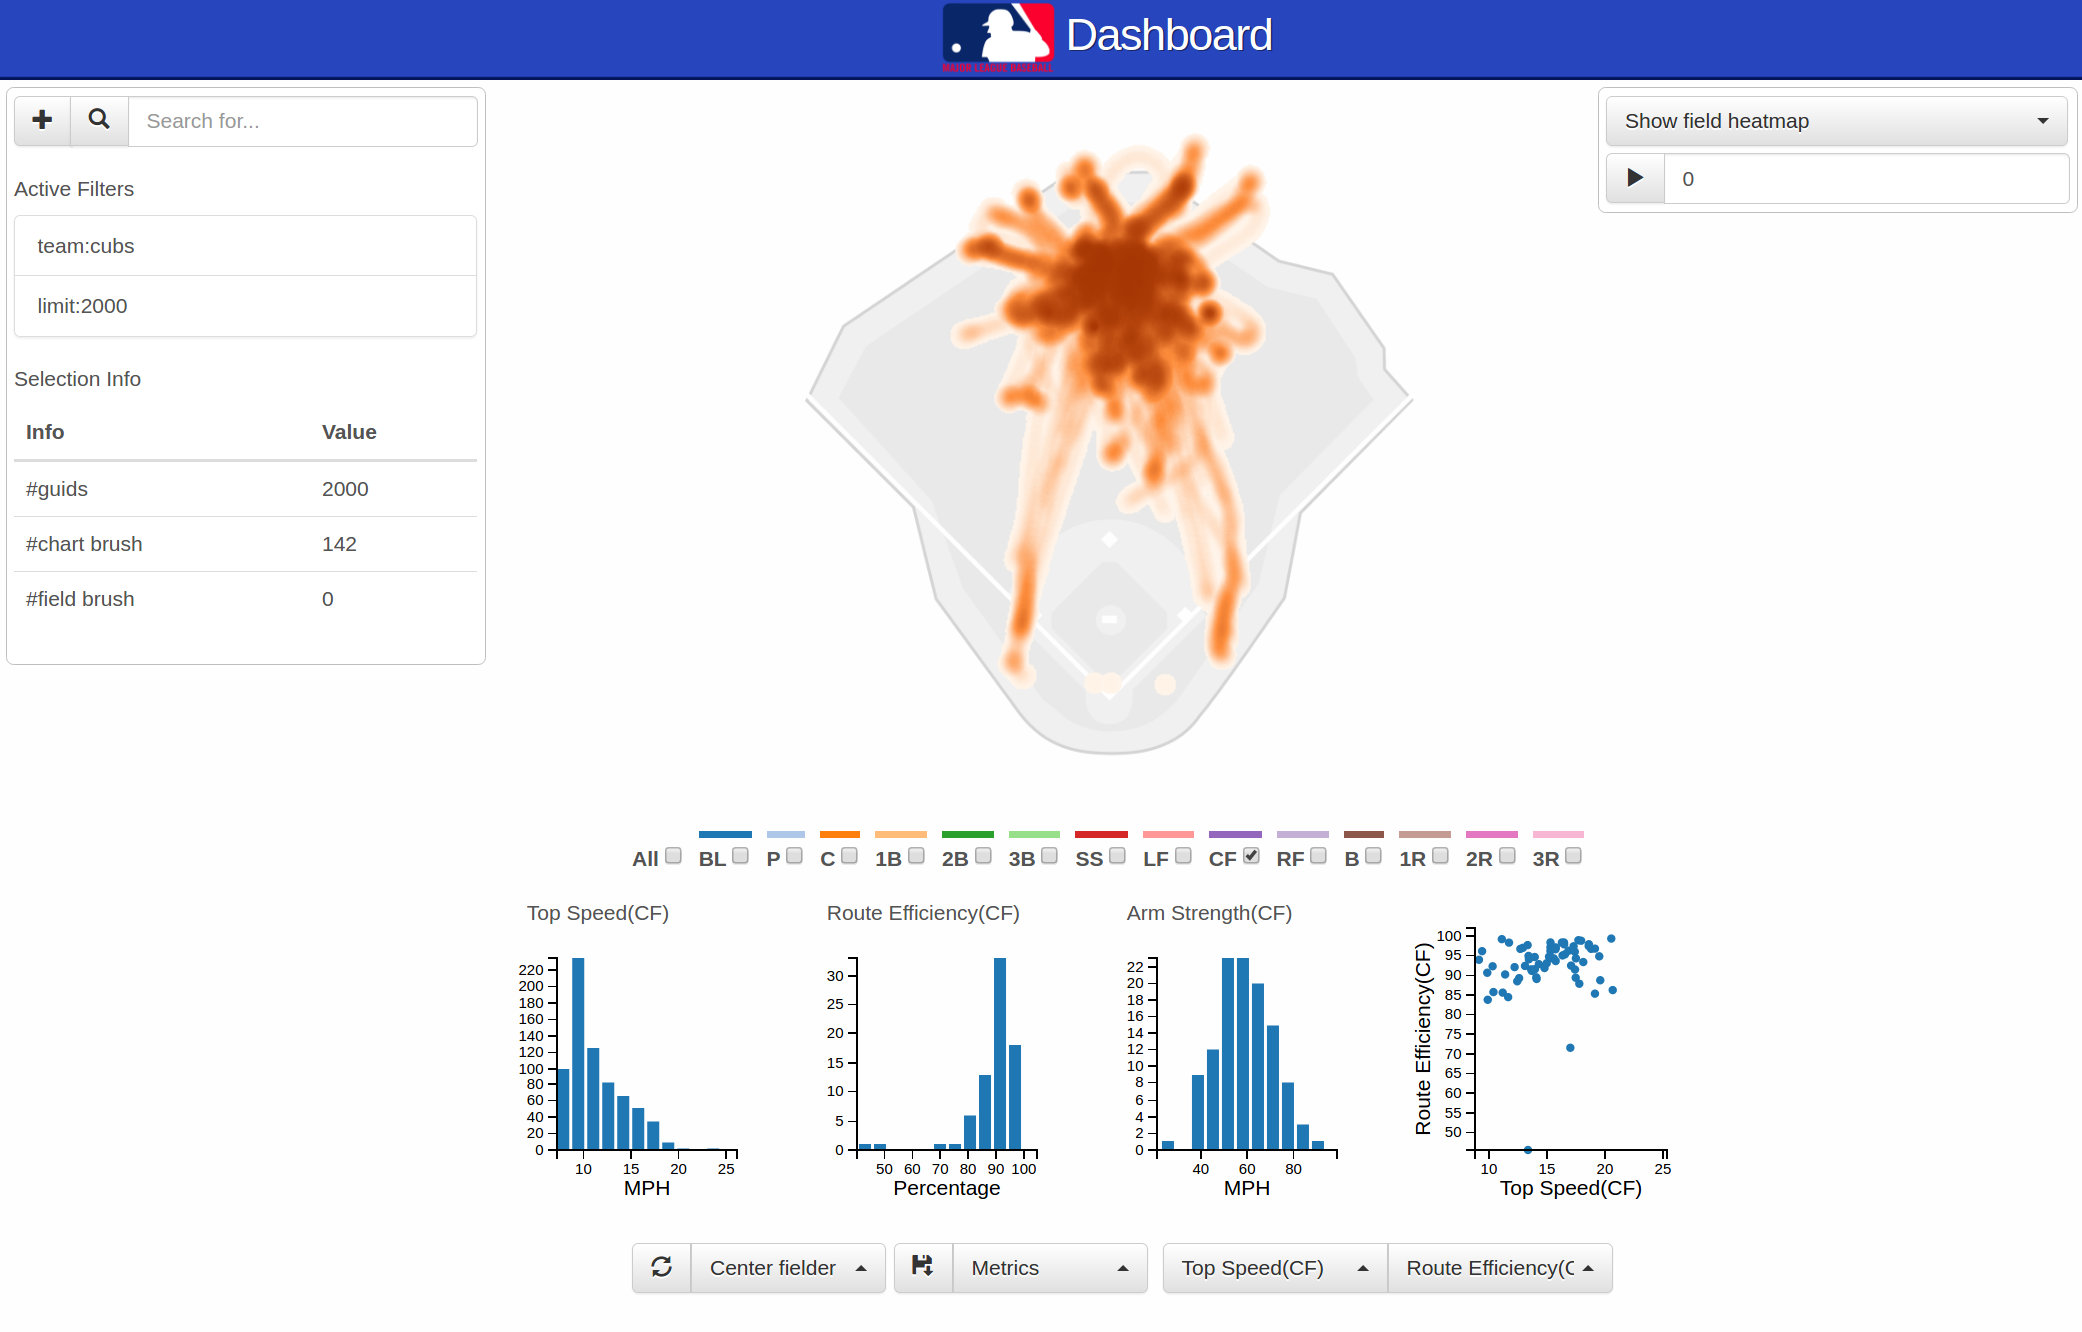
Statcast Dashboard
Published:
Paper: http://ieeexplore.ieee.org/document/7579419/
Video demo: https://www.youtube.com/watch?v=3t9PBDg4ato
Abstract: This article presents a visualization and analytics infrastructure to help query and facilitate the analysis of this new tracking data. The goal is to go beyond descriptive statistics of individual plays, allowing analysts to study diverse collections of games and game events. The StatCast Dashboard visual interface helps users query, filter, and analyze the tracking data gathered by the Major League Baseball (MLB) StatCast spatiotemporal data-tracking system. The proposed system enables the exploration of the data using a simple querying interface and a set of flexible interactive visualization tools.

