Big Scatterplot
Published:
Github: https://github.com/jorgehpo/BigScatterplot
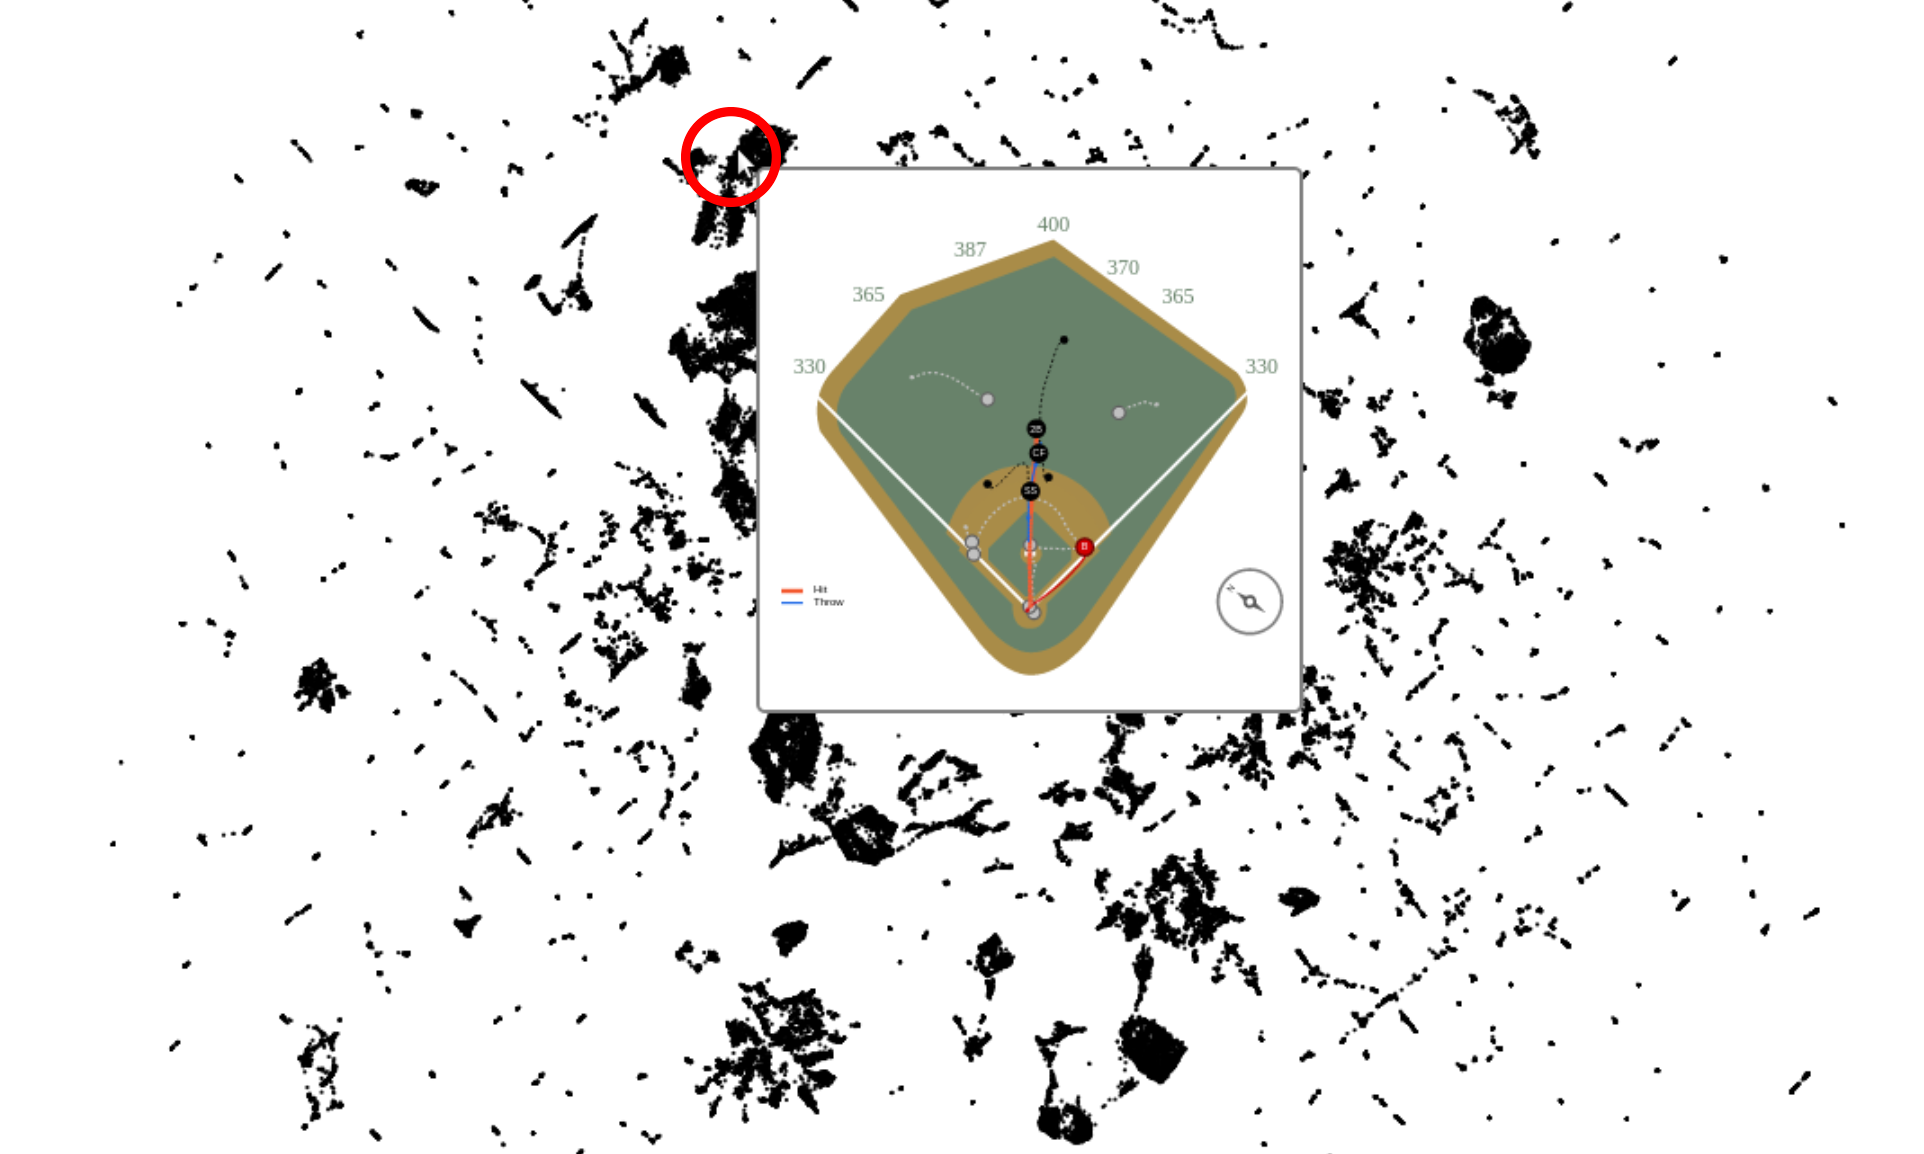
Abstract: The visualization of large datasets is a challenging task. Multidimensional projections and interactive visualizations have been extensively used to convey information about the distribution of the data and the similarities among data items. In order to explore multidimensional projections of large datasets, I implemented a simple scatterplot visualization in D3. My implementation uses the HTML Canvas to draw the points and a quadtree to check for mouse events, making the application faster and more responsive. A visualization of a large baseball dataset is shown below. The projection was computed using largevis.

